[ Research ]

Not Just a Model, But a Product

Category:

Research

Author:

Dyna Robotics

Date:

August 2026

Read:

17 min

1. Not just a model, but a product

Today, we're really excited to share an announcement our team has been working toward over the past year: our robots have successfully crossed the ROI threshold, and Din Tai Fung, the highest revenue per location restaurant chain in the US, is rolling out Dyna's robots across its restaurant network.
This commercial scale, together with our rollouts across hotels, logistics companies, and data centers (more on those soon), will bring our deployed fleet to hundreds of robots by the first half of 2027. To the best of our knowledge, this is the first time ever a robot foundation model company has taken a manipulation commercial pilot all the way to scaled deployment.
Getting there required obsessing over the parts of robotics that rarely make it into a demo.
Waymo co-CEO Dmitri Dolgov put it well: "The demo took 18 months; the product took about 15 years." We think that gap captures something fundamental about robotics. The demo is the part everyone sees. The robot picks something up, the video looks great, and it feels like the hard part is done.
In reality, that's when a different kind of work starts. You have to deal with the weird edge cases, recovery, uptime, integrations, economics, and all the tiny failures that only show up after the robot has been doing the job every day for months. It's much less exciting to show on camera, but that's the work that turns a demo into a product.
The unsexy half, everything after the demo, is what we want to talk about today.
2. "Both" is our way

The robotics field tends to sort companies into two buckets: research labs building brains, and application companies deploying in the field.
When a customer buys a robot, they don't really care which bucket you are in, how novel the model is, or how impressive the demo looked. They care about much simpler things: does it do the job reliably, and does the economics make sense?
We chose to do both. That's why Dyna is a research-driven product company.
The product gives the research a real target, and the research keeps the product from turning into a pile of one-off fixes. We want to push the frontier, but we also want those capabilities to hold up when a customer depends on them every day.
That philosophy became a pretty simple rule for us: never solve a field issue with a one-off fix. Every problem had to leave something behind, whether that was better tooling, infrastructure, a reusable integration, or a more general model. Over time, that loop became important enough that we created a Deployment Research division around it.
After months of what felt like pushing a boulder uphill, the effects of that compounding finally started to show up in production. Then, we got the text from the Din Tai Fung team in 2025 that changed everything.
That was the first time we felt the boulder start rolling on its own. The question had changed from "does this work?" to "how fast can we ship?" And that was the moment we realized the work wasn't just making each deployment better—it was making deployment itself repeatable.

3. How Dyna-2 closed the gaps

3.1. World Understanding, in production

Last year, after we celebrated the success of Dyna-1, reality set in. Folding 850 napkins in 24 hours was great. But it was nowhere near enough.
To keep the Din Tai Fung dining room supplied, each robot needs to produce 1,500 table-ready napkins in an 18-hour shift. When we first launched last year, Dyna-1 was producing about 480. It was folding roughly 35 napkins an hour, and only 75% cleared the quality bar, even though at the time of its publication, it was the most reliable robot foundation model ever released. That meant we needed to nearly triple throughput and significantly cut the defect rate at the same time.
Speed and quality pulled against each other. Consistently clearing our table-ready quality bar meant more time flattening and perfecting each fold, and every one of those costs time in a budget the restaurant had already set. Neat and fast were competing for the same seconds.
Today, Dyna-2 folds 95 napkins an hour, and 93% meet the quality bar, which comes to 1,590 table-ready napkins a day. Neither improvement came from one-off solutions engineering. They came from the models and infrastructure underneath: better pretraining, new model capabilities, stronger tooling, and the systems we built around them.

Figure 1. Dyna-1 vs Dyna-2 autonomous folding comparison. Dyna-2 folds significantly faster and at higher quality than Dyna-1, even with an additional folding step.

Throughput020406080100120napkins per hour35Dyna-195Dyna-2Quality0%10%20%30%40%50%60%70%80%90%100%% of folds at production grade75%Dyna-193%Dyna-2
Dyna-1 · June 2025Dyna-2 · August 2026

Figure 2. Dyna-2 folds 2.7× more napkins an hour than Dyna-1, at higher quality.

3.2. Model steerability enables real-world task completion

A folded napkin isn't a finished job. It has to go into a bin, stacked, ready for a member of staff to pick up and carry to the tables.
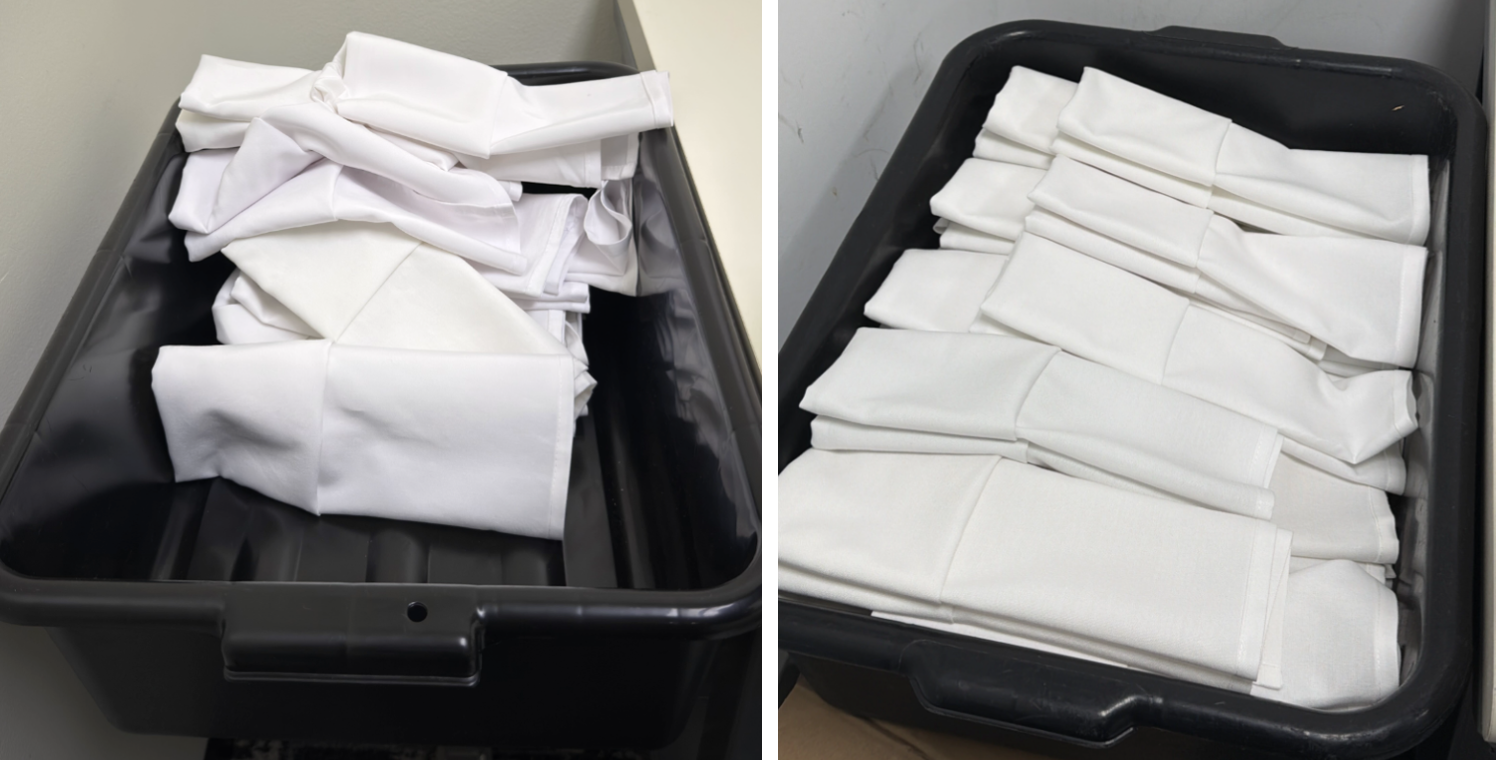
For months our napkins were folded well, but the bins were disorganized. The robot was placing each napkin wherever it happened to land, so staff had to square up the stacks before carrying them out. We had automated the folding, but not the tidying.
To get this right, the folded napkins have to be placed precisely at instructed positions in a cyclic manner. In other words, the model must be steerable, following instructions precisely and reliably.
This is one out of many examples where the gap between a demo and a working product turns out to be a missing fundamental model capability, and not one you would think to build without running the work in the real world. In fact, nearly every commercially viable task we've found requires some sort of instruction following in order to be solved, on repeat, which makes steerability a fundamental capability rather than a nice-to-have.
That's what moved up the priority of language following in our research roadmap. Many demonstrations of language following ask the model to distinguish between visibly different actions: open the drawer, pick up the candy, close the drawer. Ten bin positions in one small bin is much harder: visually, each placement looks nearly identical. Without precise language following, the model can't reliably place the napkin in the intended position, which is exactly what restaurant staff would then have to fix.
Today the napkin goes into one of ten designated stacks, and which stack comes from the instruction it is given.

Figure 3. The same bin before with Dyna-1 and after with Dyna-2 language following capabilities.

There were easier ways to solve this for one restaurant. We could have trained a model for that specific bin, or hard-coded the positions, and it would have worked until the bins changed. Some sites use smaller bins that hold five stacks, others use larger ones that hold 10, but a model-per-bin configuration isn't a business we want to be in.
Language following is the version that scales: one model, and an instruction that says where the napkin goes. The model infers the rest from what it sees, so a new bin configuration is a different instruction rather than a different model. In our Dyna-2 research, we've established that our model architecture and data recipe can effectively boost the model's general instruction following, leading to a much simpler approach to precise bin placement. Today, the capability is built into our pretraining and generalizes across environments and bins out of the box.

4. Deployment is the eval

A model can prove it works in one long session. A product has to keep working through drift, wear, edge cases, and everything else the real world throws at it. A capable model gets you to production. Sustained performance is what keeps you there.
In a lab, evaluating performance has a cheap answer. Run the model for tens of trials, have a grader watch the robot live, score the results. When models are nowhere near production-grade, that's sufficient: you're looking for whether the thing works at all, and an hour of evals will tell you.
The problem is what that answer conflates and what it misses. Our internal benchmarks told us the model was improving, but they couldn't tell us whether it would still be working at a customer site months later. An hour of testing catches a model that doesn't work. It doesn't catch one that fails once every two hundred trials, degrades over a week, or runs fine on this robot and badly on the one beside it. And it says nothing about the site itself: stations get rearranged, lighting shifts, suppliers change materials. The benchmark holds still. The site doesn't.
It was clear to us that to truly land robot foundation models in real-world deployments, we needed something much more. The eval had to move to where the real work is.
Not a test we run, but a measurement that never stops: every episode a robot produces, at every site, graded on the customer's own definition of good.
That turns evaluation into an infrastructure problem before it is a research one. Getting a robot's full workday off the machine over networks we don't control. Labelling every episode, because nothing in a system log tells you whether a completed manipulation was acceptable. Tracking the condition of every robot, because the machine drifts even when nothing about the model has changed.
All of that starts with one deceptively simple question:

What did the robot do today?

A seemingly innocuous query like this in fact layers many different levels of complexity that must be answered for any robot deployment. A robot can emit clean logs for an entire shift and still perform the task poorly. It can run every control loop on time while an arm gradually loses precision.
So a fleet needs both levels of observation. End-to-end: did the task succeed and meet the customer's standard? Granular: what happened inside the attempt, which grasp slipped, which step ran long, which joint is drifting?
Together, those two levels set the bar for what we record: enough to understand what the robot was doing at any specific moment—and, when it matters, to reproduce that behavior after the fact.
In practice, that means camera streams, robot state, control commands, application events, and hardware telemetry, with enough timing information to reconstruct how the streams line up. Across Dyna's deployed fleet, that record is large and growing: it's already over a terabyte of raw data every day, produced continuously, by every robot, every shift.
The challenge isn't collecting the data. It's turning that volume of production data into something we can actually use.

4.1. The data has to survive the real world

Formal episodes on our robot runtime system cover model rollouts at deployment sites, but a service can crash between them, and a robot can enter an unexpected state when no episode is active. We can't assume every event worth investigating falls between a recording's start and stop.
So our robot runtime continuously maintains a fixed-size, in-memory window of recent activity. As new data arrives, it replaces the oldest data in the window. When the system or the operator detects an alert or diagnostic condition, it promotes the relevant window to durable storage as a replayable episode, preserving the lead-up to the event and a short interval after it. Episodes land on local disk first; upload runs asynchronously as connectivity allows, and the local copy is deleted only after the upstream copy is verified.

Figure 4. Formal episodes cover runs; the always-on recorder covers everything in between.

4.2. What the data makes possible

Uploaded episodes help us answer questions along three axes: across time (how one robot changes), across the fleet (how behavior varies by site, hardware, and checkpoint), and across the task (what happened inside a single attempt). All of these point at one decision: which production data shapes the next model.

Turning episodes into semantic observability

Many customer tasks are defined by clear standard operating procedures. At Din Tai Fung, for example, a napkin fold follows a specific sequence of steps, and the finished napkin must meet a high visual standard. That structure comes from the customer's definition of quality: both how the work should be performed and how the result should look.
To understand and improve a robot repeating this task more than a thousand times a day, we need to be able to ask and answer questions at the level of individual steps:

Which step takes the longest?

Where does the model fail most often?

Which step has the most missed grasps?

How do these patterns change across sites, robots, and model checkpoints?

An episode captures the evidence for all of that, but it doesn't contain the answer. Camera streams and structured signals do not by themselves identify each SOP step, its outcome, or its failure mode in a form we can query across the fleet. At a small scale, we could recover that by watching every recording. Across a deployment, however, most of a robot's day is routine; finding a few informative moments would mean watching through hours of otherwise unremarkable work.
Labeling is the key unlock. We built an automatic labeling system into our data processing pipeline that processes every episode. Working from the aligned views derived from the recording, it segments each run into the steps of the task's SOP: which step the robot was performing, when it began and ended, whether it succeeded, and which failure mode applied when it did not.
Each labeled episode renders as a staircase: every SOP step is a stair, its width is the time spent on that step, and outcome and failure mode labels run underneath. Placed end-to-end, those staircases turn a full day of robot operation into something you can read at a glance. The repeated shape makes routine work easy to scan, a step that suddenly stretches or starts collecting failures stands out immediately, and every interval links straight back to that moment in the camera streams and structured data.

Figure 5. Dyna fleet label platform, showing a robot's day rendered as repeated SOP staircases, with step duration encoded by width and grades and failure modes automatically labelled underneath.

The workflow is deliberately hybrid. Automated labeling provides the first-pass coverage required to operate at fleet scale. Human attention is spent where it carries the most information: new tasks and label ontologies, rare or ambiguous outcomes, low-confidence outputs, suspected regressions, and a sampled slice used to measure labeling quality itself. Those reviews do double duty. They protect the accuracy of the metrics the fleet is judged by, and they produce the corrections that improve the labeling system, so review keeps moving toward the next unresolved slice instead of re-labeling routine behavior.
The same labels make the underlying episodes queryable. We can retrieve only the missed grasps that occurred during a particular step, compare how frequently they occur and how long that step takes across model checkpoints, or narrow the results by site, robot, hardware state, and date. The same queries also tell us whether the current data mix has enough examples of a behavior we're trying to improve. Every result links back to the corresponding moment in the original episode, so an aggregate pattern is never more than a click from the evidence behind it.
Here's what that looks like in practice. A few months ago, one of our Din Tai Fung sites started slipping on throughput. Nothing in the logs explained it, and nobody on site had reported anything unusual. The autolabels narrowed it down quickly. Failures were climbing in Step 1 of the SOP, where the robot pulls a single napkin off the stack, and nearly all of them were the same failure mode: missed grabs. Every missed grab means a retry, and the retries showed up as time.

Time per SOP Step

0s2s4s6s8s10s12s14sseconds per SOP step+4.4sS1S2S3S4S5S6S7S8S9S10S11
Two weeks agoNow

Figure 6.1. Time spent on each SOP step at the affected site, two weeks apart. Step 1 accounted for more than half of the increase.

Failure Modes by Week

0100200300400500600700800failure eventsImprecise bin placement: 28 (28 cumulative)Drop: 42 (70 cumulative)Poor flattening: 46 (116 cumulative)Double grab: 59 (175 cumulative)Imprecise fold: 74 (249 cumulative)Missed grab: 108 (357 cumulative)2 weeks agoImprecise bin placement: 31 (31 cumulative)Drop: 39 (70 cumulative)Poor flattening: 44 (114 cumulative)Double grab: 60 (174 cumulative)Imprecise fold: 118 (292 cumulative)Missed grab: 210 (502 cumulative)1 week agoImprecise bin placement: 29 (29 cumulative)Drop: 44 (73 cumulative)Poor flattening: 41 (114 cumulative)Double grab: 62 (176 cumulative)Imprecise fold: 169 (345 cumulative)Missed grab: 380 (725 cumulative)This week
Missed grabImprecise foldDouble grabPoor flatteningDropImprecise bin placement

Figure 6.2. Labelled failure event count by mode at the affected site, week over week. Total failures roughly doubled, and missed grabs account for most of the increase.

Figure 6.3: A failure mode drill-down. Every missed grab matching a query, retrieved together and played side by side. Filters run across date, site, SOP step, robot, and model checkpoint.

It turned out to be a worn gripper. That is a fix the labels could locate but never diagnose: a worn gripper and a bad policy look the same in an episode, and telling them apart is a different problem.

Predicting hardware failures before they happen

Mechanical components degrade gradually and continuously. Our customers build their daily operations around these systems, so reliability isn't just a fleet metric; it's part of the trust we have to earn at every site. That means detecting degradation before it interrupts a shift. The default maintenance posture, however, is reactive: you learn a component was failing when it fails, at a customer site, during a shift. That is unplanned downtime, the most expensive way to learn anything.
The catch is that from the outside, mechanical degradation is easy to mistake for a model regression or a software change.
The episodes already contain what we need to tell them apart: robot state shows a joint that's drawing more current or tracking its commanded path less precisely, and camera streams show the physical result: a gripper that closes differently, a fold that lands a few millimeters off. Collected continuously, that becomes a history of how each robot changes over time. We combine that history with regular calibration and degradation checks, which gives us a controlled reference to map changes against.
Acute eventstypical day-to-day variationmodel performance becomes hardware-limitedacute eventmaintenance window(model performance unaffected)flagged: day-over-day change isstatistically significantwithout intervention: hardwarebegins to limit model performanceDyna Degradation IndexTime

Figure 7. A degradation index for one component, tracked against the robot's own baseline. We flag a fault the same day it appears, well before the point where wear starts to limit the model. Illustrative: the pattern is real, the values are not shown.

Production telemetry adds the context needed to interpret those checks: whether a signal is isolated to one robot, trending across similar hardware, or correlated with a software change. Together, these views help us distinguish persistent mechanical degradation from noise or a model regression, then proactively schedule a service visit or component replacement instead of waiting for a failure during a shift.

5. The deployment flywheel

None of this is monitoring for its own sake.
Each labelled episode is a record of how the current model behaves in production, on cases no purpose-built collection effort would have thought to stage. Together, they show where the model succeeds, where it breaks, and how that balance is moving. The same pipeline that tells us a robot is slow tells us what the next round of training has to contain.
The problem becomes curation rather than volume. Training on the right few hours can beat training on more of the wrong data, and the record supplies the dimensions that define right: task step, outcome, failure mode, quality, site, hardware state, checkpoint. Each new checkpoint returns to the fleet, where the same instrumentation tells us whether it helped.
Every deployment makes the next one easier. A failure mode found at one deployment becomes a query we run across the fleet. A hardware check written for one robot protects every robot with the same components. A production slice that improves a checkpoint raises quality and throughput everywhere that model is deployed. So we arrive at each new site with a broader picture of real-world conditions, earlier warnings for problems we have seen before, and a data mix shaped by more production experience. And that site expands the picture and reveals the next set of gaps.
The same evidence reaches further back. What we learn about where models struggle in production is starting to shape what we pre-train on, not just what we post-train on, and that is the bigger lever.
That compounding loop is why we keep deploying. With the infrastructure we've built, a new Dyna deployment, from setup to meeting production ROI bar, is as short as three days. We got there by choosing the slower path early: reusable models, tooling and infrastructure instead of a fix for every site.
For a long time, robotics made it feel like you had to choose: build frontier intelligence in the lab, or ship products in the field. We don't think that tradeoff is real. Deployment isn't what pulls research away from the frontier. It's what tells you where the frontier actually matters. It exposes the problems worth solving, forces those solutions to survive in production, and gives you the only feedback that really counts: did it work reliably?
That's not "applied research." It's simply what building a real research product looks like.

[ Stay Updated ]

Our research straight to your inbox.

[ DYNA ]

Newsletter Signup

© 2026 DYNA Robotics Inc.